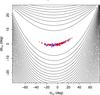
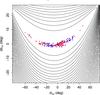
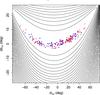
Fig. 5

Relative position (Δlcp,Δbcp) of the CP for 100 simulations and three different velocity dispersions. Blue dots and red crosses denote, respectively, the results of the classic and new CPSMs. The contours indicate X2 levels linearly spaced by ΔX2 = 2000 for a cluster with the properties given in the text. The relative position of the computed CP  for each simulation is given by
  and
and  .
.
Current usage metrics show cumulative count of Article Views (full-text article views including HTML views, PDF and ePub downloads, according to the available data) and Abstracts Views on Vision4Press platform.
Data correspond to usage on the plateform after 2015. The current usage metrics is available 48-96 hours after online publication and is updated daily on week days.
Initial download of the metrics may take a while.