Fig. 8
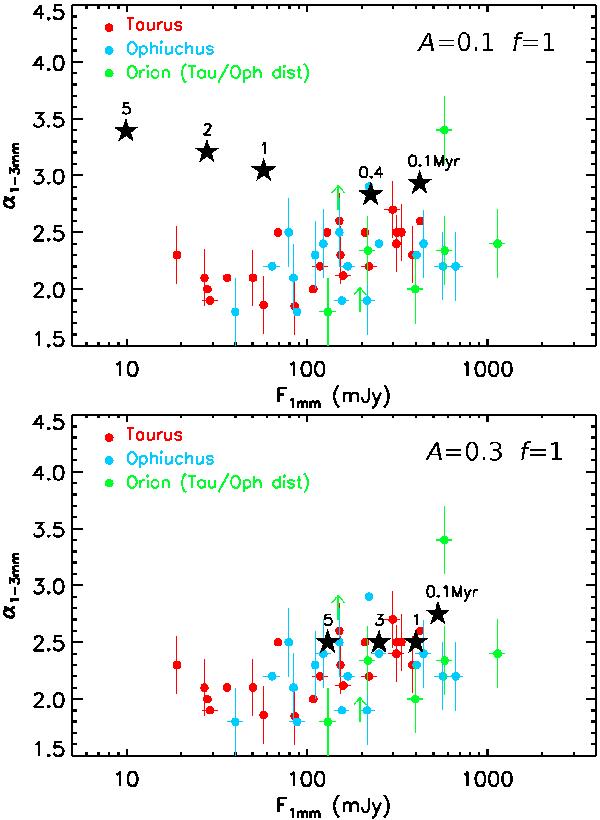
Comparison of the observed fluxes at mm-wavelengths of young disks in Taurus (red dots; from Ricci et al. 2010a; and Ricci, priv. comm.), Ophiucus (blue dots; from Ricci et al. 2010b), and Orion Nebula Cluster (green dots; from Ricci et al. 2011) star-forming regions with the predictions of the disk models at different times in the disk evolution (star symbols). Disk ages are indicated by numbers, in Myr, above the star symbols. The predicted ~1 mm-fluxes (x-axis) and spectral indices between ~1 mm and 3 mm (y-axis) are for the disk models presented in Sect. 2 with perturbations characterized by f = 1 and either A = 0.1 (top panel) or A = 0.3 (bottom panel). The ~1 mm-flux densities for the Orion disks have been scaled by a factor of (420 pc/140 pc)2 to account for the different distances estimated for the Orion Nebula Cluster (~420 pc, Menten et al. 2007) and Taurus and Ophiucus star-forming regions (~140 pc, Bertout et al. 1999; Wilking et al. 2008).
Current usage metrics show cumulative count of Article Views (full-text article views including HTML views, PDF and ePub downloads, according to the available data) and Abstracts Views on Vision4Press platform.
Data correspond to usage on the plateform after 2015. The current usage metrics is available 48-96 hours after online publication and is updated daily on week days.
Initial download of the metrics may take a while.