Fig. 2
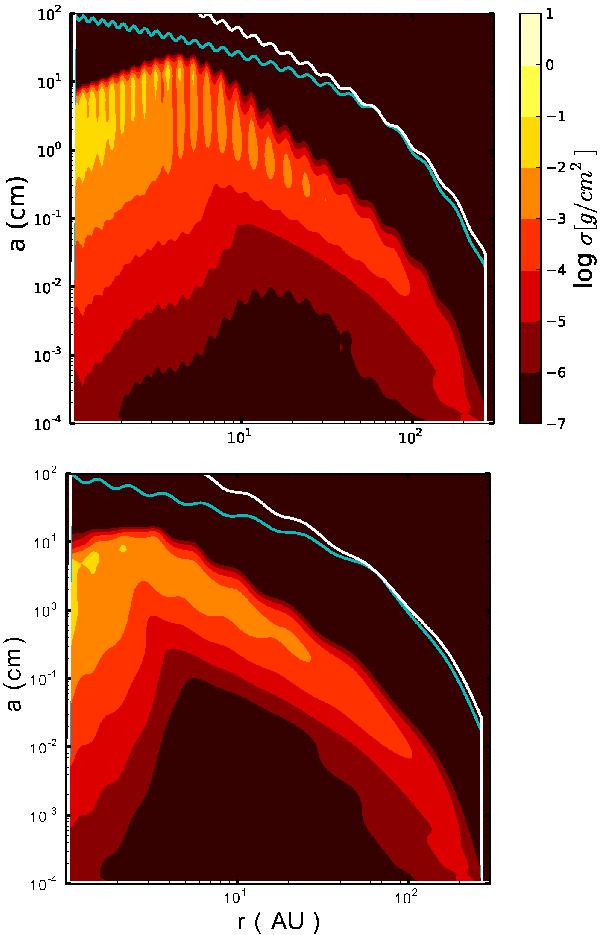
Vertically integrated dust density distribution at 1 Myr for A = 0.1 and f = 1 (top) and A = 0.1 and f = 3 (bottom). The white line shows the particle size corresponding to a Stokes number of unity, which shows the same shape as the gas surface density Σ′ of Eq. (1) (see Eq. (8)). The blue line represents the maximum size of the particles before they reach fragmentation velocities (fragmentation barrier according to Eq. (15)).
Current usage metrics show cumulative count of Article Views (full-text article views including HTML views, PDF and ePub downloads, according to the available data) and Abstracts Views on Vision4Press platform.
Data correspond to usage on the plateform after 2015. The current usage metrics is available 48-96 hours after online publication and is updated daily on week days.
Initial download of the metrics may take a while.