Fig. 13
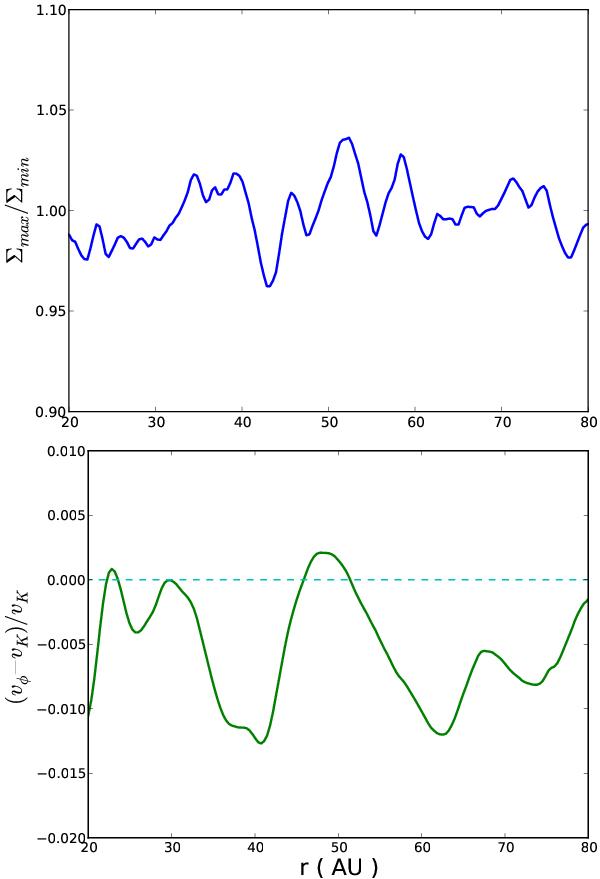
Top plot: ratio of the surface density at two different azimuthal angles of of the disk from zonal flows simulation of Uribe et al. (2011). The azimuthal angles are chosen such that for a specific radius, the amplitude of the pressure bump has a maximum Σmax, and a minimum Σmin. Bottom plot: azimuthal velocity with respect to the Keplerian velocity for the azimuthal and time-averaged surface density of the midplane.
Current usage metrics show cumulative count of Article Views (full-text article views including HTML views, PDF and ePub downloads, according to the available data) and Abstracts Views on Vision4Press platform.
Data correspond to usage on the plateform after 2015. The current usage metrics is available 48-96 hours after online publication and is updated daily on week days.
Initial download of the metrics may take a while.