Fig. 1
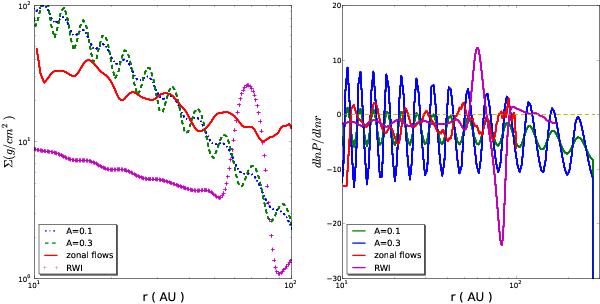
Comparison between the gas surface density (left plot) taken in this work (Eq. (1)) for two different values of the amplitude and constant width (dashed and dot-dashed lines). The Rossby wave instability (Regaly et al. 2012), and the presence of zonal flows caused by MHD instabilities (Uribe et al. 2011). Right plot shows the pressure gradient for each of the gas surface density profiles.
Current usage metrics show cumulative count of Article Views (full-text article views including HTML views, PDF and ePub downloads, according to the available data) and Abstracts Views on Vision4Press platform.
Data correspond to usage on the plateform after 2015. The current usage metrics is available 48-96 hours after online publication and is updated daily on week days.
Initial download of the metrics may take a while.