Free Access
Fig. 1
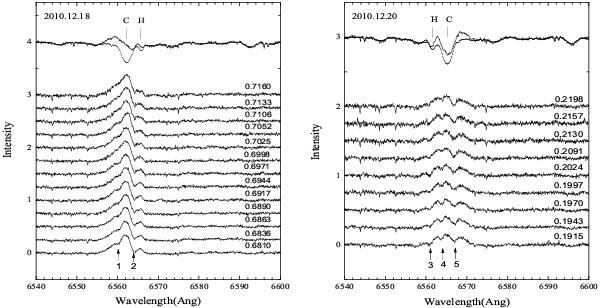
Observed, synthetic and subtracted spectra for the Hα line. The top lines show an example of the observed (solid) and synthesized (dotted) spectra, while the lower solid lines represent the subtracted spectra. The numbers indicate absorption features appearing in the subtracted Hα spectral profiles.
This figure is made of several images, please see below:
Current usage metrics show cumulative count of Article Views (full-text article views including HTML views, PDF and ePub downloads, according to the available data) and Abstracts Views on Vision4Press platform.
Data correspond to usage on the plateform after 2015. The current usage metrics is available 48-96 hours after online publication and is updated daily on week days.
Initial download of the metrics may take a while.