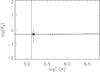
Fig. 4
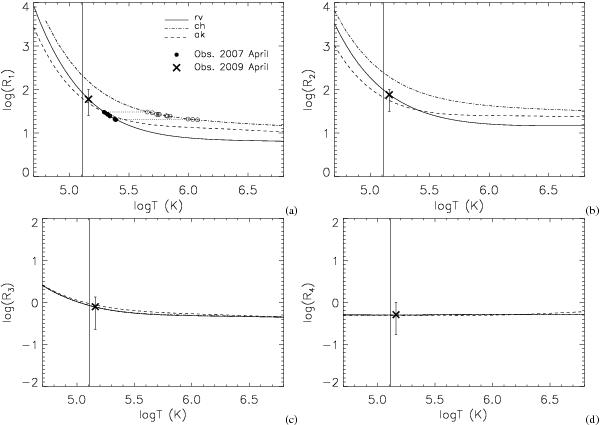
Comparison between the theoretical and measured ratios of O iv: a) R1; b) R2; c) R3; d) R4. The theoretical ratios have been obtained from the three datasets: CHIANTI, denoted as ch; revised, denoted as rv; and Aggarwal & Keenan (2008), denoted as ak. The filled circles indicate the observations of April 2007 taken from Muglach et al. (2010), while the crosses, with the error bars, represent the observations of April 2009. The open circles show where the observational points of April 2007 must be plotted if the CHIANTI data are adopted as in Muglach et al. (2010). The intensity units are photons cm-3 s-1. The adopted electron density is Ne = 1010 cm-3. The vertical lines are at the O iv temperature formation, log Tm = 5.11. Note that the ch, rv and ak data are basically identical for the ratios R3 and R4 shown in panels c) and d).
Current usage metrics show cumulative count of Article Views (full-text article views including HTML views, PDF and ePub downloads, according to the available data) and Abstracts Views on Vision4Press platform.
Data correspond to usage on the plateform after 2015. The current usage metrics is available 48-96 hours after online publication and is updated daily on week days.
Initial download of the metrics may take a while.