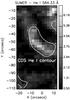
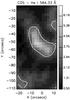
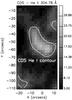
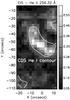
Fig. 3
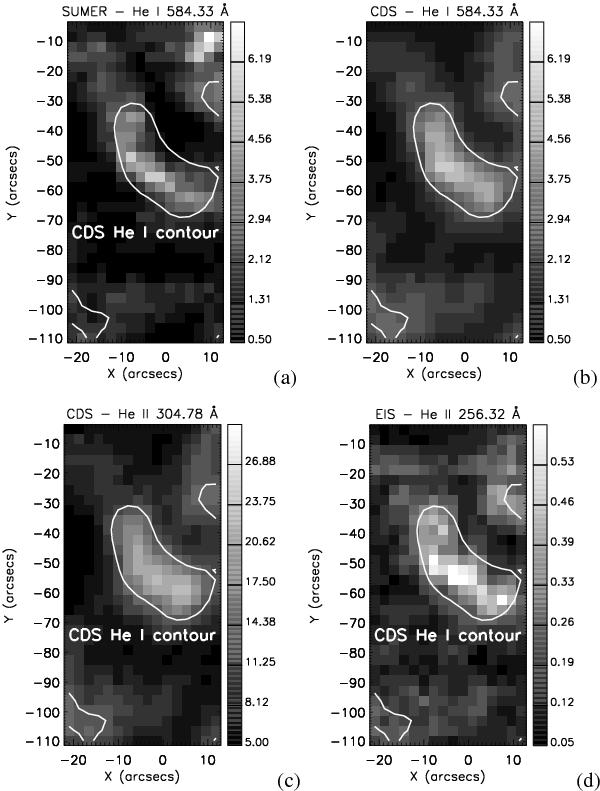
Final cropped rasters of SUMER, CDS and EIS. He i 584.33 Å line intensity distribution is shown for SUMER and CDS a) and b). He ii 304.78 Å and He ii 256.32 Å doublet intensity distributions are displayed in c) and d) respectively. The first one is observed by CDS, the second one by EIS. The white solid line overplotted on each image is the contour of CDS He i 584.33 Å intensity. The intensity scale unit is 1013 photons cm-2 s-1 sr-1.
Current usage metrics show cumulative count of Article Views (full-text article views including HTML views, PDF and ePub downloads, according to the available data) and Abstracts Views on Vision4Press platform.
Data correspond to usage on the plateform after 2015. The current usage metrics is available 48-96 hours after online publication and is updated daily on week days.
Initial download of the metrics may take a while.