Free Access
Fig. 8
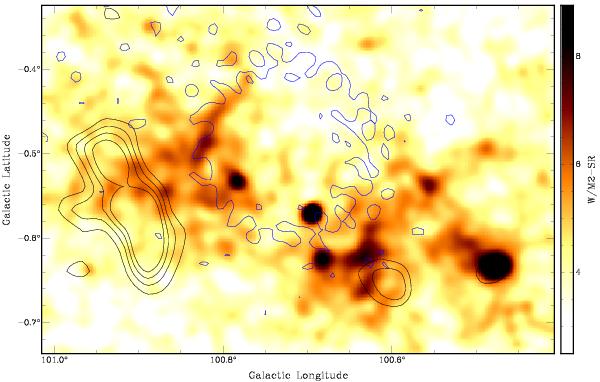
8.3 μm emission distribution in the area of G100. The blue contour corresponds to the 5.8 K level at 1420 MHz. Black contours are associated with the CO emission distribution averaged between –52.25 and –55.17 km s-1, at 0.4, 0.6, 0.8 and 1.0 K.
Current usage metrics show cumulative count of Article Views (full-text article views including HTML views, PDF and ePub downloads, according to the available data) and Abstracts Views on Vision4Press platform.
Data correspond to usage on the plateform after 2015. The current usage metrics is available 48-96 hours after online publication and is updated daily on week days.
Initial download of the metrics may take a while.