Fig. 7
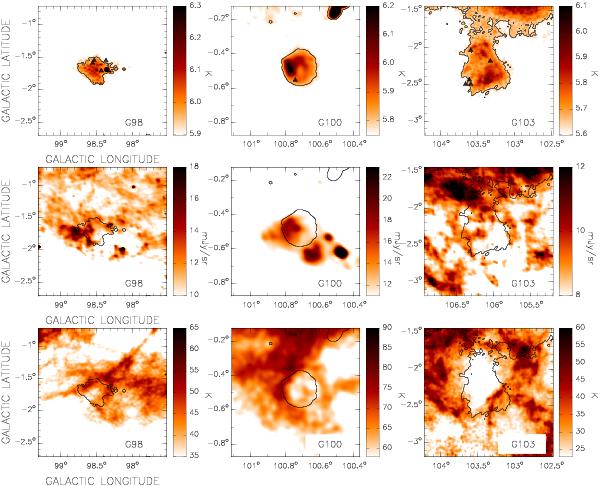
Upper panels: 1420 MHz radio continuum images in the area of G98 (left), G100 (middle), and G103 (right). Point-like sources have been removed. Contour levels are at 6.0, 5.8, and 5.6 K, for G98, G100, and G103, respectively. The black triangle symbols indicate the location of the stars HD 235673, ALS 12073, ALS 12071 and ALS 12074 (G98), BD+542684 (G100), and ALS 12434, ALS 12443, ALS 12471, ALS 12469 and ALS 12475 (G103). Middle panels: HIRES 60 μm emission distribution in the area of G98, G100 and G103. For comparison with the 1420 MHz emission, contour levels are the same as in upper panels. Lower panels: CGPS H i emission distribution averaged in the velocity range from –41.9 to – 50.9 km s-1 in the area of G98 (left), from –50.9 to –55.9 km s-1 in the area of G100 (middle) and from –29.5 to –31.15 km s-1 in the area of G103 (right). Contour levels are the same as for upper and middle panels. In all images the angular resolution is 2-arcmin.
Current usage metrics show cumulative count of Article Views (full-text article views including HTML views, PDF and ePub downloads, according to the available data) and Abstracts Views on Vision4Press platform.
Data correspond to usage on the plateform after 2015. The current usage metrics is available 48-96 hours after online publication and is updated daily on week days.
Initial download of the metrics may take a while.