Free Access
Fig. 6
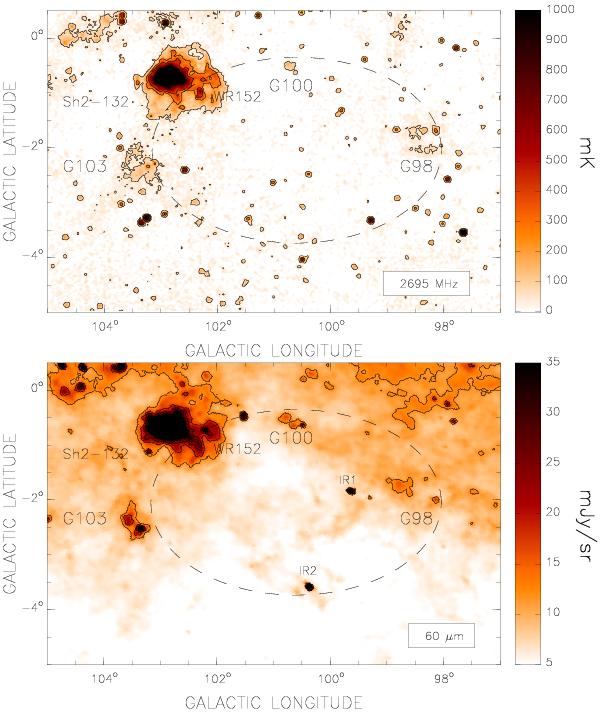
Upper panel. Effelsberg 2695 MHz emission distribution in the area of GS 100–02–41. Contour levels are at 65, 250 and 400 mK. Lower panel. IRIS 60 μn emission distribution. Contour levels are at 12, 18 and 24 mJy sr-1. In both panels the ellipse marks the location of the large H i shell.
Current usage metrics show cumulative count of Article Views (full-text article views including HTML views, PDF and ePub downloads, according to the available data) and Abstracts Views on Vision4Press platform.
Data correspond to usage on the plateform after 2015. The current usage metrics is available 48-96 hours after online publication and is updated daily on week days.
Initial download of the metrics may take a while.