Fig. 2
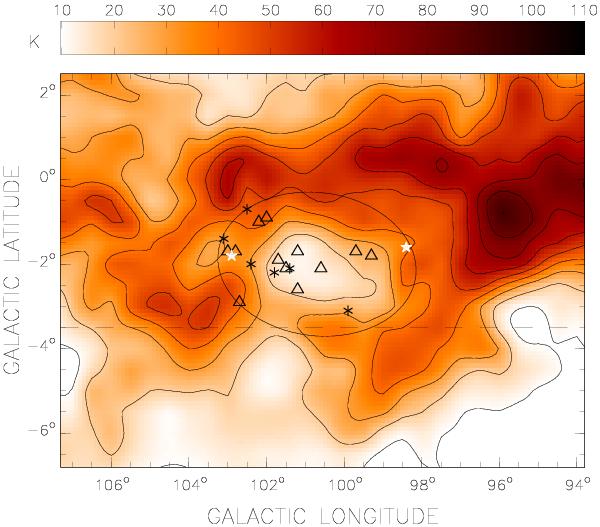
LAB H i emission distribution averaged in the velocity range from –42.26 to –34.02 km s-1. Contour levels are from 10 to 90 in steps of 10 K. The area below the dashed line corresponds to the region where CGPS data are not available. The symbols indicate the location of the star members of Cep OB1 lying inside the ellipse (see Sect. 3.3). White star symbols correspond to O-type main-sequence stars. Asterisks and triangles indicate evolved stars that were O-type and B-type stars during the main-sequence phase, respectively.
Current usage metrics show cumulative count of Article Views (full-text article views including HTML views, PDF and ePub downloads, according to the available data) and Abstracts Views on Vision4Press platform.
Data correspond to usage on the plateform after 2015. The current usage metrics is available 48-96 hours after online publication and is updated daily on week days.
Initial download of the metrics may take a while.