Fig. 1
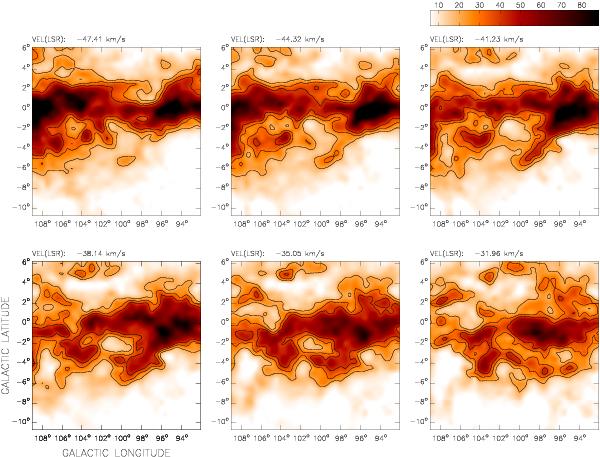
LAB H i emission distribution in the velocity range from −47.41 to −31.96 km s-1. Each image is an average of three velocity channel maps. Contour levels are at 20, 30, and 40 K. The LSR central velocity of each image is indicated in its top left corner. The color bar-code shows the temperature scale in kelvin for all the images.
Current usage metrics show cumulative count of Article Views (full-text article views including HTML views, PDF and ePub downloads, according to the available data) and Abstracts Views on Vision4Press platform.
Data correspond to usage on the plateform after 2015. The current usage metrics is available 48-96 hours after online publication and is updated daily on week days.
Initial download of the metrics may take a while.