Fig. 7
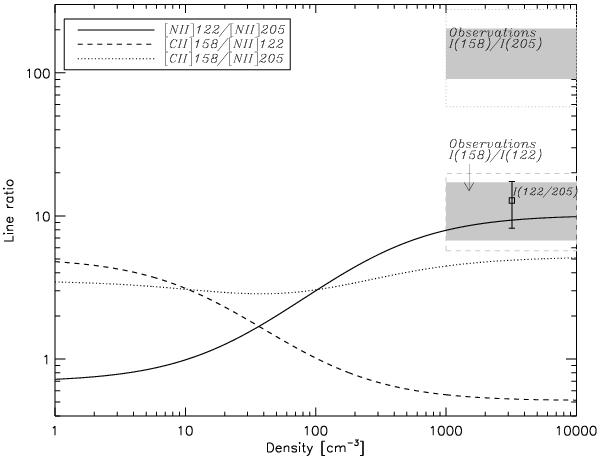
Line intensity ratios for different combinations of the [N ii] (122 and 205 μm) and [C ii] 158 μm lines. Theoretical curves are shown by the solid, dotted, and dashed lines. Grey areas indicate the range of observed ratios, and the enclosing boxes represent the range of uncertainties in the ratios. The square point is the ratio of the [N ii] 122/205 lines.
Current usage metrics show cumulative count of Article Views (full-text article views including HTML views, PDF and ePub downloads, according to the available data) and Abstracts Views on Vision4Press platform.
Data correspond to usage on the plateform after 2015. The current usage metrics is available 48-96 hours after online publication and is updated daily on week days.
Initial download of the metrics may take a while.