Free Access
Fig. 3
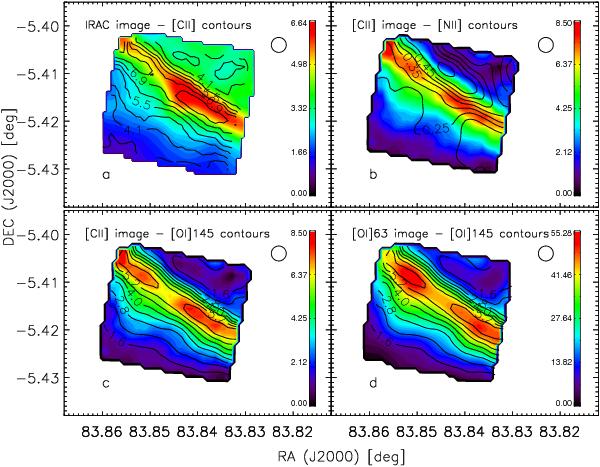
Image and contour plots for different combination of lines and 8 μm band as indicated in the title of each panel. All maps have been convolved to the PSF at 158 μm and are in flux units of 10-6 W m-2 sr-1 (except for the IRAC image which is in 103 MJy sr-1). Here the intensity scales start at zero.
Current usage metrics show cumulative count of Article Views (full-text article views including HTML views, PDF and ePub downloads, according to the available data) and Abstracts Views on Vision4Press platform.
Data correspond to usage on the plateform after 2015. The current usage metrics is available 48-96 hours after online publication and is updated daily on week days.
Initial download of the metrics may take a while.