Fig. B.1
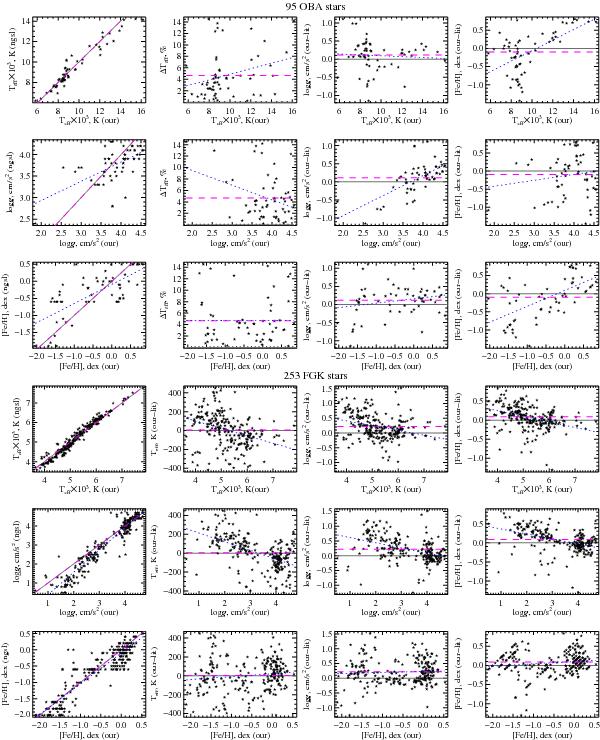
Comparison of the original stellar atmospheric parameters published for the NGSL with those derived here using ULySS and the MILES interpolator. The median value of the residuals are plotted in magenta-dashed lines, while the fit to the residuals are plotted as blue-dotted lines. The one-to-one relation is shown in black. The upper three rows of panels show the results for the OBA stars. The remaining sets of panels show the results for the FGK stars. For each set of stellar spectral types we show in the first column of panels the comparison of the temperature, gravity, and metallicity values from top to bottom. In the last three columns of panels we show the residuals in temperature, gravity, and metallicty (from left to right) as a function of temperature, gravity, and metallicity (from top to bottom).
Current usage metrics show cumulative count of Article Views (full-text article views including HTML views, PDF and ePub downloads, according to the available data) and Abstracts Views on Vision4Press platform.
Data correspond to usage on the plateform after 2015. The current usage metrics is available 48-96 hours after online publication and is updated daily on week days.
Initial download of the metrics may take a while.