Fig. 3
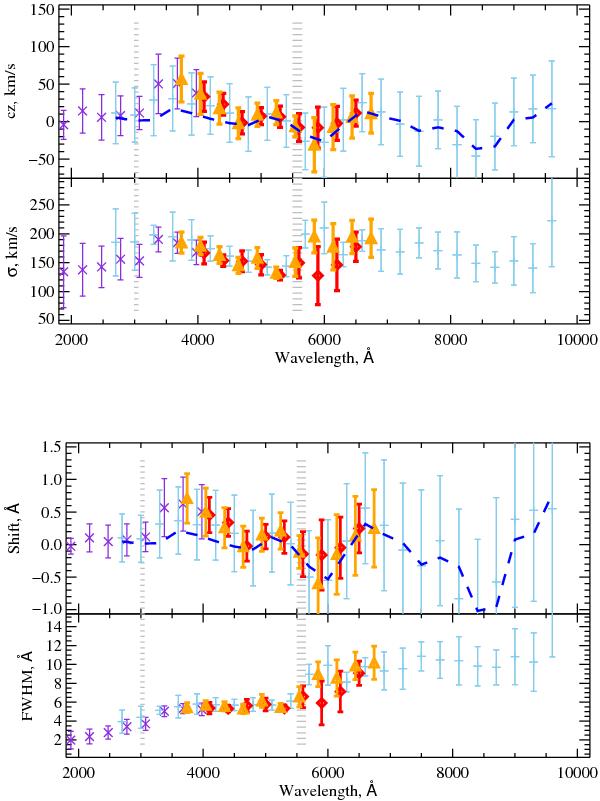
Global line-spread function of NGSL. The upper panels show the residual velocity and instrumental velocity dispersion in km s-1. The bottom panels show the corresponding wavelength shift and resolution in Å. The LSFs obtained with the aid of the various reference libraries are overplotted with the symbols according to the legend in the first panel. The error bars represent the standard deviations from the distribution of the LSF obtained with the individual stars. The regions where the three segments of NGSL overlap are marked with grey horizontal lines. The blue dashed line shows the applied correction to the velocity shift. (MILES and ELODIE libraries have different starting points, therefore their results appear slightly shifted.)
Current usage metrics show cumulative count of Article Views (full-text article views including HTML views, PDF and ePub downloads, according to the available data) and Abstracts Views on Vision4Press platform.
Data correspond to usage on the plateform after 2015. The current usage metrics is available 48-96 hours after online publication and is updated daily on week days.
Initial download of the metrics may take a while.