Free Access
Fig. 1
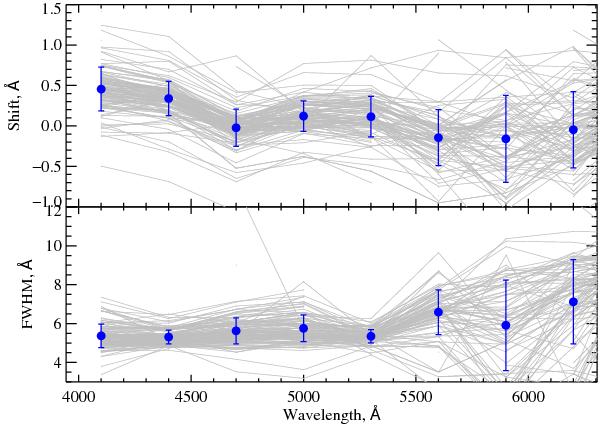
Relative LSF for the 127 NGSL stars in common with the ELODIE library. The panels show the shift in wavelength and the resolution (FWHM) as a fucntion of wavelength. The obtained LSFs for the individual stars are plotted in thin grey lines. The mean values and their standard deviations are plotted in blue.
Current usage metrics show cumulative count of Article Views (full-text article views including HTML views, PDF and ePub downloads, according to the available data) and Abstracts Views on Vision4Press platform.
Data correspond to usage on the plateform after 2015. The current usage metrics is available 48-96 hours after online publication and is updated daily on week days.
Initial download of the metrics may take a while.