Fig. 9
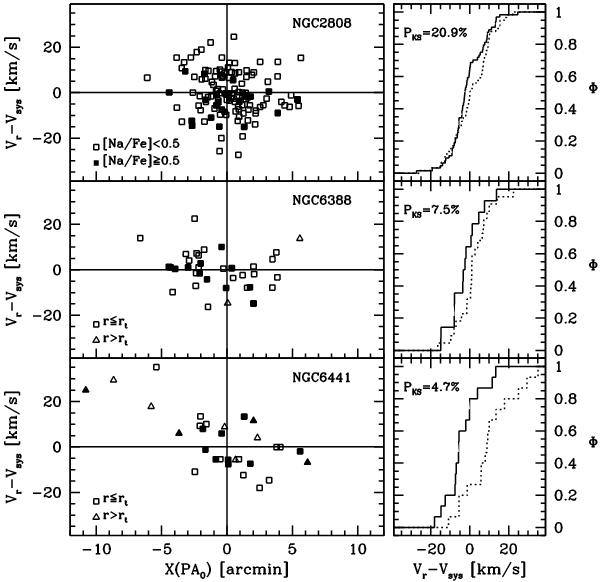
Rotation curves for NGC 2808, NGC 6388, and NGC 6441. Filled and open symbols are adopted for Na-rich and Na-poor stars, respectively. Left panels: RV in the system of the cluster as function of distance from the center projected onto the axis perpendicular to the best-fit rotation axis found in Figs. 7 and 8. Stars inside and outside the tidal radius are plotted with different symbols for NGC 6441 and NGC 6388. All the stars in the NGC 2808 sample lie within the tidal radius on the cluster. Right panels: comparison of the cumulative RV distributions of stars having X(PA0) > 0.0 (continuous lines) and X(PA0) < 0.0 (dotted lines). The probability that the two distributions are drawn from the same parent population (according to a KS test) is reported in each panel. We show rotation curves only for the two clusters having PKS < 10% plus NGC 2808.
Current usage metrics show cumulative count of Article Views (full-text article views including HTML views, PDF and ePub downloads, according to the available data) and Abstracts Views on Vision4Press platform.
Data correspond to usage on the plateform after 2015. The current usage metrics is available 48-96 hours after online publication and is updated daily on week days.
Initial download of the metrics may take a while.