Fig. 7
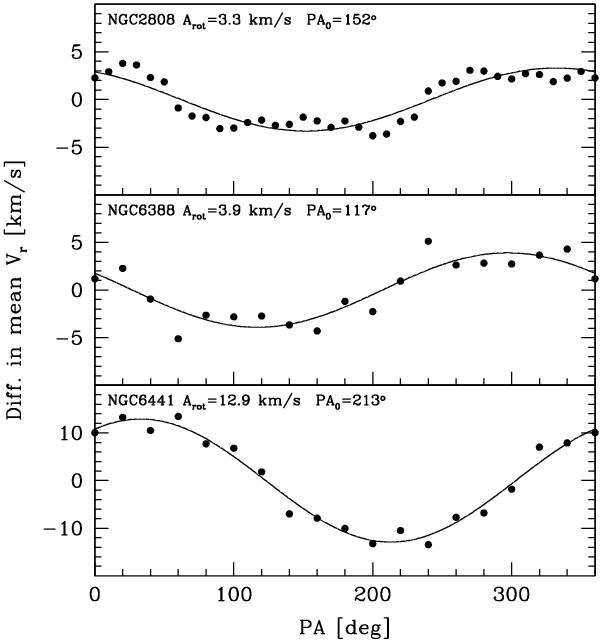
Rotation in NGC 2808, NGC 6388, and NGC 6441. The plots display the difference between the mean velocities on each side of a cluster with respect to a line passing through the cluster center with a position angle PA (measured from north to east, north = 0°, east = 90°), as a function of the adopted PA. The adopted line coincides with the projected rotation axis. The continuous line is the sine law that best fits the observed pattern. The vertical scale used for NGC 6441 is larger, to accommodate the strong rotation signal. It is also worth noting that even limiting the NGC 6441 sample to the 21 stars lying within the tidal radius (see Fig. 5) the rotation pattern is very similar, with Arot ≃ 11 km s-1 and PA0 ≃ 225°.
Current usage metrics show cumulative count of Article Views (full-text article views including HTML views, PDF and ePub downloads, according to the available data) and Abstracts Views on Vision4Press platform.
Data correspond to usage on the plateform after 2015. The current usage metrics is available 48-96 hours after online publication and is updated daily on week days.
Initial download of the metrics may take a while.