Fig. A.1
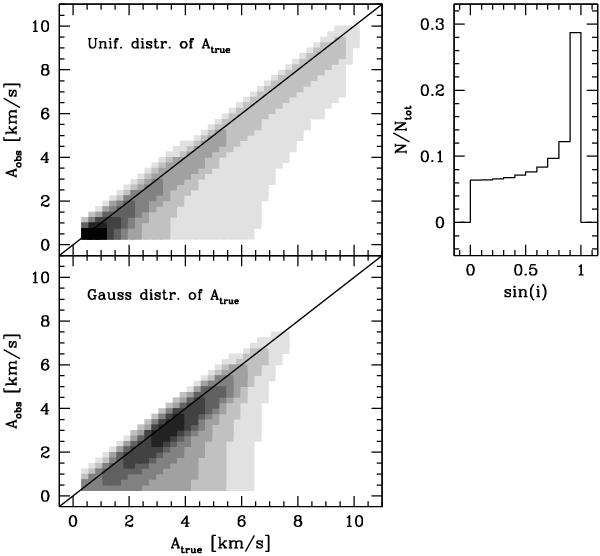
Left panels: probability distribution of observing a rotation amplitude (Aobs) given a true value of the amplitude (Atrue) and a uniform distribution of inclination angles (i). Different tones of gray indicate different probability levels, from 8% (darkest gray) to 1% (lightest gray), in steps of 1%; white regions corresponds to probability below 1%. The continuous line is the Aobs = Atrue relation. In the upper panel Atrue values are drawn from a uniform distribution, in the lower panel they are drawn from a Gaussian distribution. The probability is estimated in square bins with sides of 1.0 km s-1 spaced by 0.25 km s-1 in both directions of the plane. Right panel: distribution of sin(i) for a uniform distribution of i.
Current usage metrics show cumulative count of Article Views (full-text article views including HTML views, PDF and ePub downloads, according to the available data) and Abstracts Views on Vision4Press platform.
Data correspond to usage on the plateform after 2015. The current usage metrics is available 48-96 hours after online publication and is updated daily on week days.
Initial download of the metrics may take a while.