Fig. 10
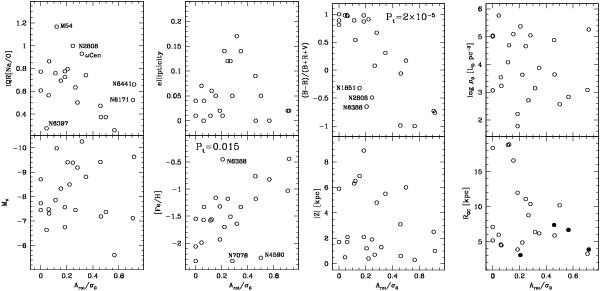
The ratio between the amplitude of the rotation Arot to the central velocity dispersion σ0 is plotted versus various other parameters. The clusters that appear to lie at odd positions with respect to the main trends are labeled. In the rightmost panel of the lower row, clusters having [Fe/H] ≥ − 1.0 are plotted as filled circles.
Current usage metrics show cumulative count of Article Views (full-text article views including HTML views, PDF and ePub downloads, according to the available data) and Abstracts Views on Vision4Press platform.
Data correspond to usage on the plateform after 2015. The current usage metrics is available 48-96 hours after online publication and is updated daily on week days.
Initial download of the metrics may take a while.