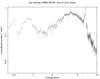
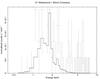
Fig. 1
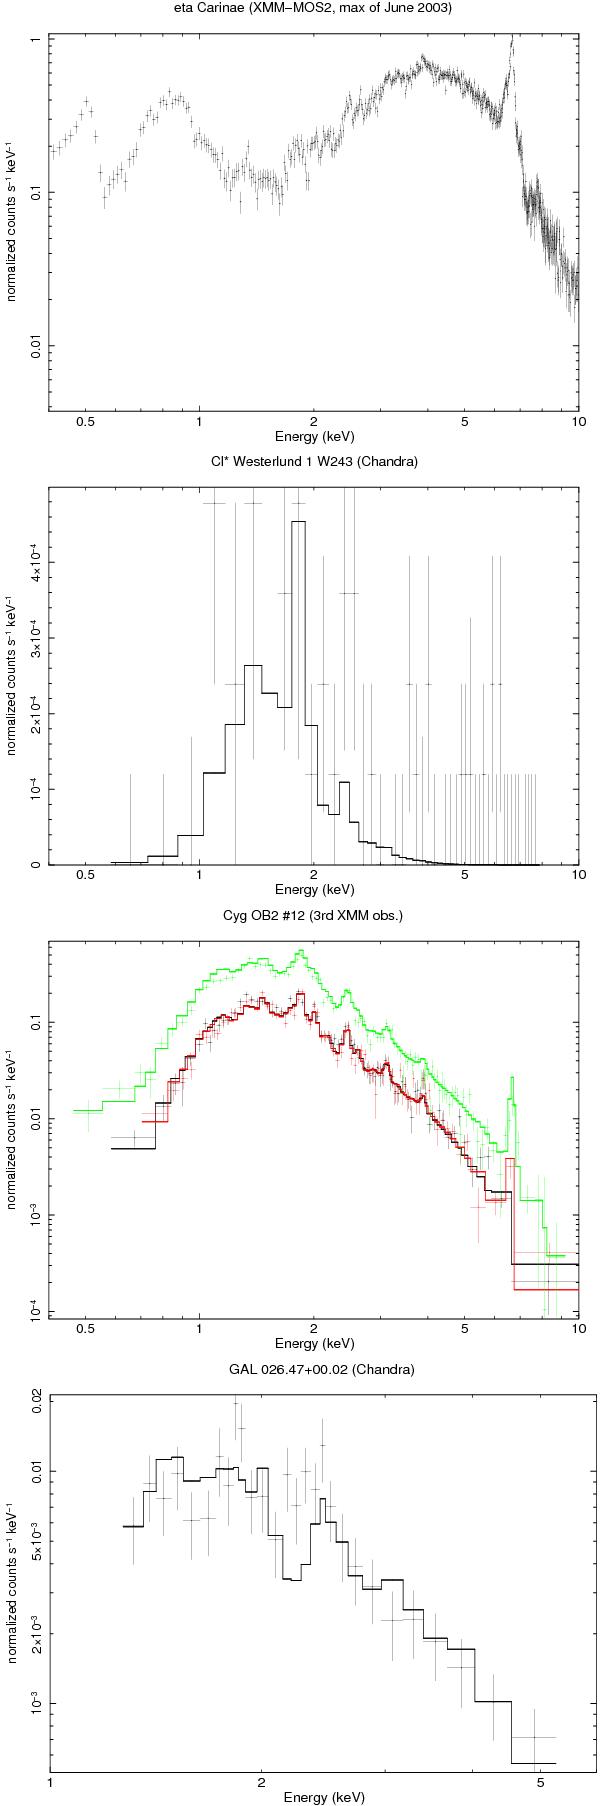
X-ray spectra of the detected LBVs (from top to bottom: eta Car – from the 2XMM database, W243, Cyg OB2 #12 – from Rauw 2011, and GAL 026.47+00.02), along with their best-fit model (see text for details). The eta Car spectrum corresponds to XMM-MOS2 data taken at the June 2003 maximum, which are dominated by the soft emission of the outer ejecta below 1.5 keV and by colliding-wind emisson above that limit (Hamaguchi et al. 2007). The W243 spectrum corresponds to the 5′′ extraction region, and was re-binned by a factor of 10. Note the strong iron line at 6.7 keV for eta Car and Cyg OB2 #12.
Current usage metrics show cumulative count of Article Views (full-text article views including HTML views, PDF and ePub downloads, according to the available data) and Abstracts Views on Vision4Press platform.
Data correspond to usage on the plateform after 2015. The current usage metrics is available 48-96 hours after online publication and is updated daily on week days.
Initial download of the metrics may take a while.