Fig. 1
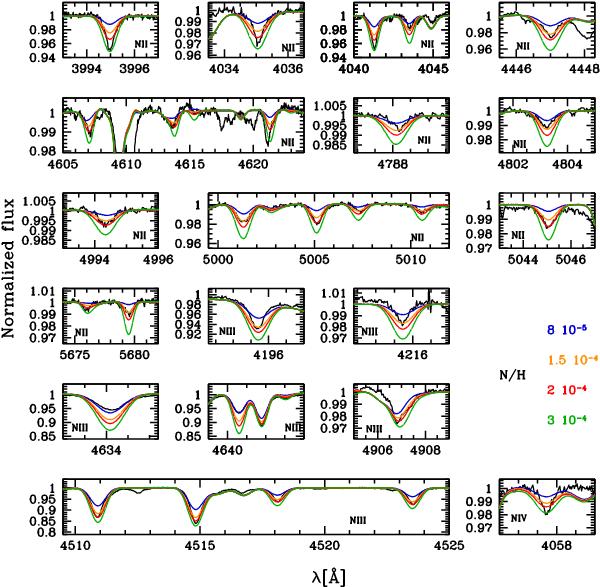
Example of fit of the nitrogen lines in HD 57682. The observed spectrum is the black solid line. The smooth colored lines are models with the best fit parameters and different values of N/H. The χ2 function is evaluated using these models to constrain the value of surface nitrogen content. In the present case, N/H = 1.3 × 10⁻⁴ is the preferred value (see Fig. 2, red curve). More models with additional N/H values have been calculated but only four are shown for clarity.
Current usage metrics show cumulative count of Article Views (full-text article views including HTML views, PDF and ePub downloads, according to the available data) and Abstracts Views on Vision4Press platform.
Data correspond to usage on the plateform after 2015. The current usage metrics is available 48-96 hours after online publication and is updated daily on week days.
Initial download of the metrics may take a while.