Fig. 1
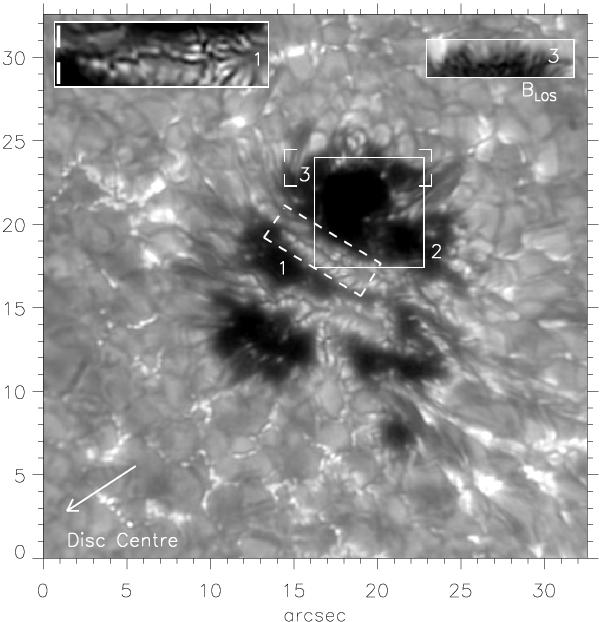
Leading spot of NOAA 11024 observed on July 4, 2009, 08:37 UT through the Ca ii K filter with FWHM 1 nm. Rectangle “1”: part of the light bridge where shear motions are found; the inset ‘1’ shows this LB area rotated to the horizontal and expanded by a factor of two. The vertical white bars in the inset represent the spatial extension selected to create the space-time slices shown in Fig. 2; rectangle “2”: part of umbra where umbral dots (UDs) were tracked; rectangle “3” (only corners marked): upper umbral border for space-time slices of the line-of-sight component of the magnetic field, BLOS. The latter also from 08:37 UT is shown in the inset “3” (dark meaning the main polarity of the sunspot BLOS).
Current usage metrics show cumulative count of Article Views (full-text article views including HTML views, PDF and ePub downloads, according to the available data) and Abstracts Views on Vision4Press platform.
Data correspond to usage on the plateform after 2015. The current usage metrics is available 48-96 hours after online publication and is updated daily on week days.
Initial download of the metrics may take a while.