Fig. 5
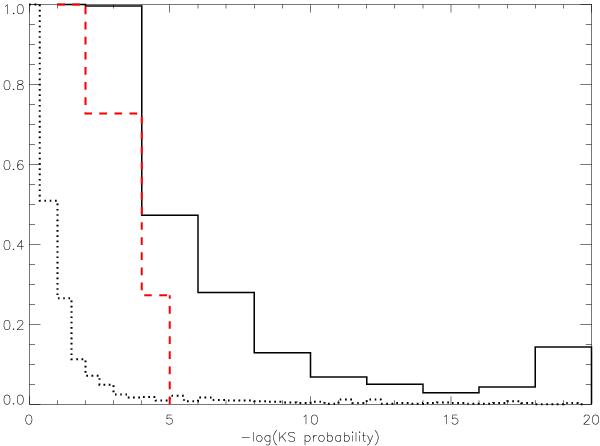
Fractional histograms of the -log Kolmogorov-Smirnov probability for three categories of objects. The solid line represents the REFLEX II clusters as in Fig. 4. We truncate the values so that the last bin contains the remaining counts for the whole sample, which amounts to 5%. The dotted lines mark 1542 non-cluster sources, and the red dashed lines are for the 22 clusters. The non-cluster sources are strongly concentrated at small extents.
Current usage metrics show cumulative count of Article Views (full-text article views including HTML views, PDF and ePub downloads, according to the available data) and Abstracts Views on Vision4Press platform.
Data correspond to usage on the plateform after 2015. The current usage metrics is available 48-96 hours after online publication and is updated daily on week days.
Initial download of the metrics may take a while.