Fig. 4
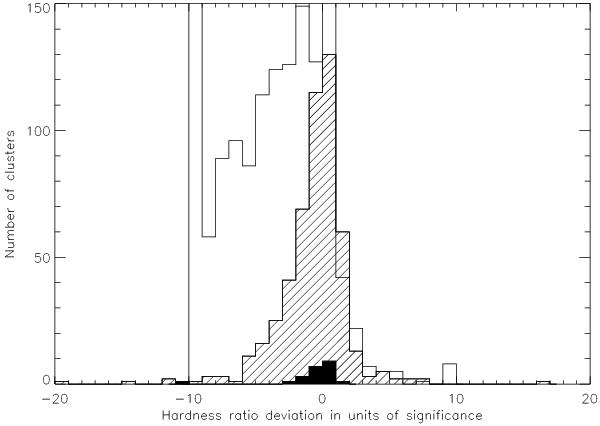
Distribution of the measured hardness ratio deviations from the expectation in units of the significance for the REFLEX II clusters is marked with the slanted lines in the histogram. The filled bars show the distribution of the cluster sample in this paper. The blank bars mark 1542 non-cluster sources identified during the construction of the REFLEX II catalogue. It is clear that the hardness deviation of the clusters has an approximate Gaussian distribution with a mean close to zero, while the non-cluster sources have a significant excess towards the negative deviations.
Current usage metrics show cumulative count of Article Views (full-text article views including HTML views, PDF and ePub downloads, according to the available data) and Abstracts Views on Vision4Press platform.
Data correspond to usage on the plateform after 2015. The current usage metrics is available 48-96 hours after online publication and is updated daily on week days.
Initial download of the metrics may take a while.