Fig. 3
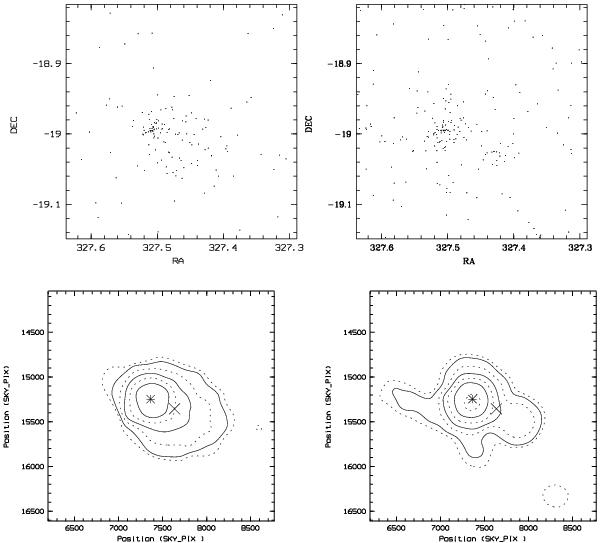
RXCJ2149.9-1859: (upper panel) photon distribution in the hard band (left) and soft band (right). Most of the emission in the soft band is identified as the Seyfert galaxy occupying a region in the north-east of the cluster centre. (lower panel) Contour plots of the significance in flux in the hard (left) and soft band (right) at 1.5, 2, 3, 4, 5, 6, 7σ per Gaussian beam of 1 arcmin width. Contours are marked with two alternating types of lines for clarity. After deblending, the centre of the cluster moves to where the cross is. Note that the location of the Seyfert galaxy is marked by an asterisk.
Current usage metrics show cumulative count of Article Views (full-text article views including HTML views, PDF and ePub downloads, according to the available data) and Abstracts Views on Vision4Press platform.
Data correspond to usage on the plateform after 2015. The current usage metrics is available 48-96 hours after online publication and is updated daily on week days.
Initial download of the metrics may take a while.