Free Access
Fig. 13
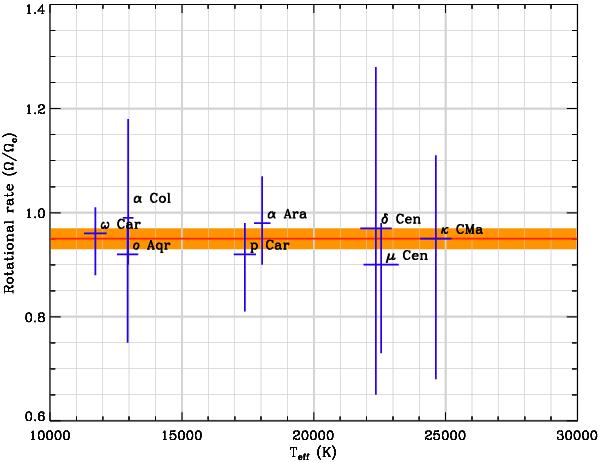
Rotational rate of our Be stars sample plotted as a function of their effective temperature. Our measurements for the eight targets and their relative uncertainties are plotted as blue vertical lines. The orange box represents the mean rotational rate, i.e. 0.95 ± 0.02.
Current usage metrics show cumulative count of Article Views (full-text article views including HTML views, PDF and ePub downloads, according to the available data) and Abstracts Views on Vision4Press platform.
Data correspond to usage on the plateform after 2015. The current usage metrics is available 48-96 hours after online publication and is updated daily on week days.
Initial download of the metrics may take a while.