Fig. 12
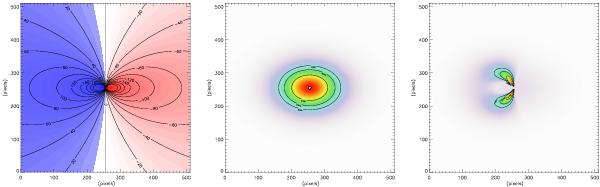
Illustration of our kinematic model. Left: two-dimensional project velocity map for a purely rotating disk with an inclination angle of 45°. The blue and red colors represent the positive and negative projected velocities, respectively. Center: global emission map in the Brγ line. It is given by a simple elliptical Gaussian with an elongation cause by the projection onto the sky plane. Right: emission map in a narrow spectral channel centered around 21 664 Å with a resolution of 1.8 Å. It is obtained using the velocity map and the emission map. See Delaa et al. (2011) for more details.

Current usage metrics show cumulative count of Article Views (full-text article views including HTML views, PDF and ePub downloads, according to the available data) and Abstracts Views on Vision4Press platform.
Data correspond to usage on the plateform after 2015. The current usage metrics is available 48-96 hours after online publication and is updated daily on week days.
Initial download of the metrics may take a while.