Free Access
Fig. 11
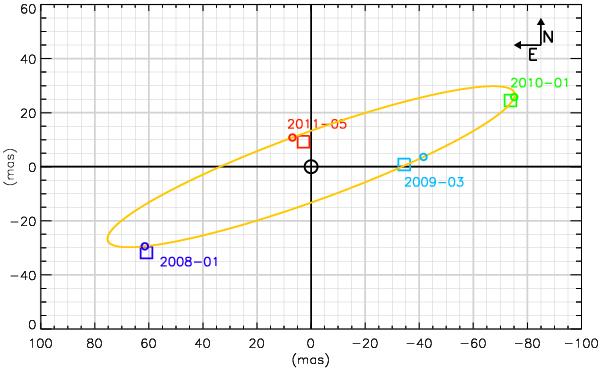
δ Cen binary separation and possible orbit. The measured separations are plotted as squares. The possible orbit is plotted as an orange solid line and the circles represents the modeled positions at the epochs of observations.
Current usage metrics show cumulative count of Article Views (full-text article views including HTML views, PDF and ePub downloads, according to the available data) and Abstracts Views on Vision4Press platform.
Data correspond to usage on the plateform after 2015. The current usage metrics is available 48-96 hours after online publication and is updated daily on week days.
Initial download of the metrics may take a while.