Free Access
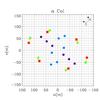
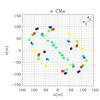
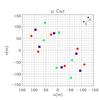
Fig. 1
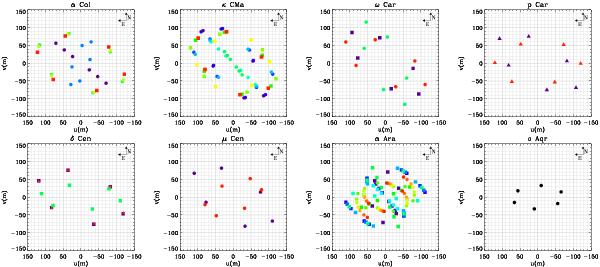
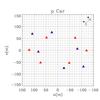
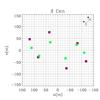
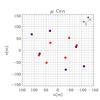
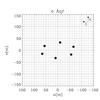
(u, v) plan coverage obtained for the observed Be stars. LR mode observations are plotted as squares, MR ones as triangles, and HR ones as circles. Each observation, i.e. three baseline measurements, is plotted with a different color.
This figure is made of several images, please see below:

Current usage metrics show cumulative count of Article Views (full-text article views including HTML views, PDF and ePub downloads, according to the available data) and Abstracts Views on Vision4Press platform.
Data correspond to usage on the plateform after 2015. The current usage metrics is available 48-96 hours after online publication and is updated daily on week days.
Initial download of the metrics may take a while.