Free Access
Fig. 7
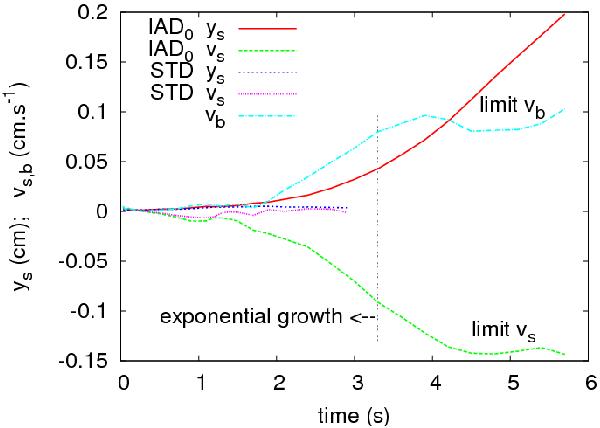
Evolution of the center of mass of the spikes during the growth of the Rayleigh-Taylor instability depicted in Fig. 6. The velocity of the center of mass of the bubbles, vb, and spikes, vs, is also shown. For t > 4 s, a limiting speed is reached.
Current usage metrics show cumulative count of Article Views (full-text article views including HTML views, PDF and ePub downloads, according to the available data) and Abstracts Views on Vision4Press platform.
Data correspond to usage on the plateform after 2015. The current usage metrics is available 48-96 hours after online publication and is updated daily on week days.
Initial download of the metrics may take a while.