Fig. 1
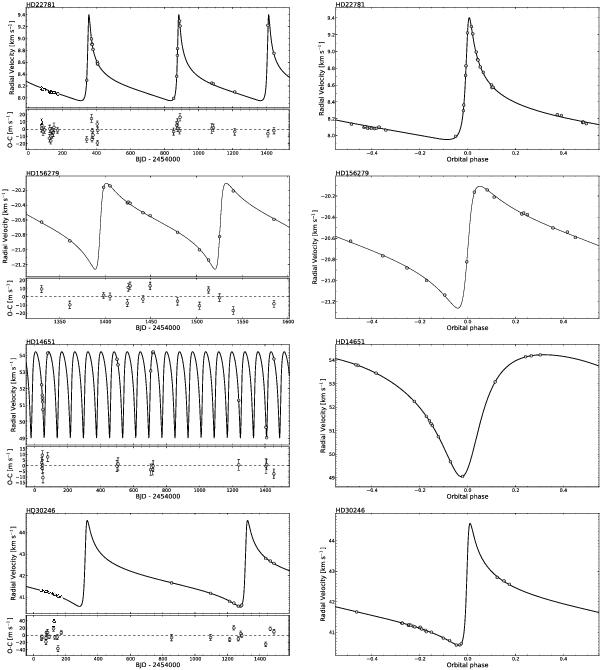
Radial velocity measurements obtained with SOPHIE for all objects studied in this paper. In the left column, the measurements are plot as a function of time, while on the right column, they have been folded to the orbital phase. The solid curve represents the best fit to the data and the lower panels on the left column show the residuals to the fit.
Current usage metrics show cumulative count of Article Views (full-text article views including HTML views, PDF and ePub downloads, according to the available data) and Abstracts Views on Vision4Press platform.
Data correspond to usage on the plateform after 2015. The current usage metrics is available 48-96 hours after online publication and is updated daily on week days.
Initial download of the metrics may take a while.