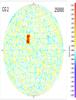
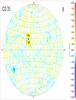
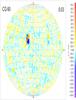
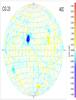
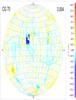
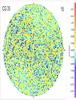
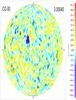
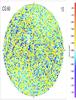
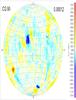
Fig. 9
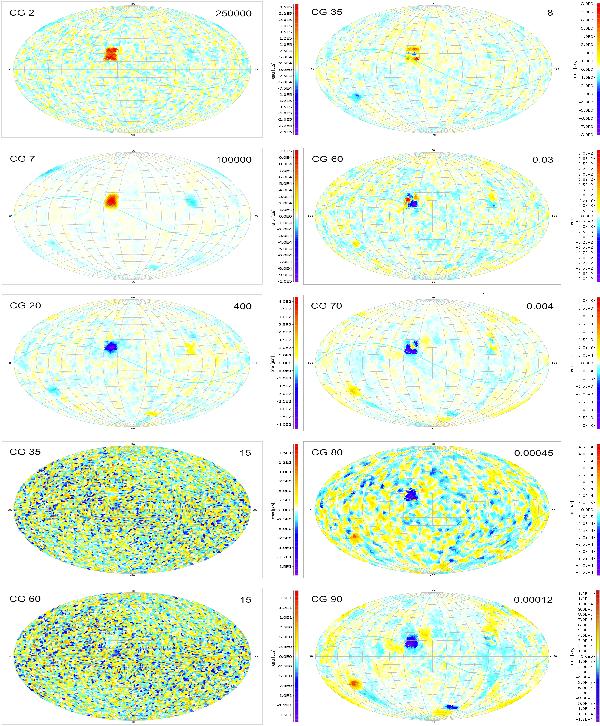
Parallax errors and truncation errors for test case B (non–uniform weight distribution). The error maps in the left column show the differences between the parallax values in selected iterations and their true values. The truncation error maps in the right column show the difference between the parallax values in selected iterations and the converged values (in iteration 100). See Fig. 2 for further explanation of the diagram layout.
Current usage metrics show cumulative count of Article Views (full-text article views including HTML views, PDF and ePub downloads, according to the available data) and Abstracts Views on Vision4Press platform.
Data correspond to usage on the plateform after 2015. The current usage metrics is available 48-96 hours after online publication and is updated daily on week days.
Initial download of the metrics may take a while.