Free Access
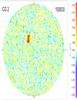
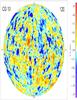
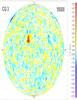
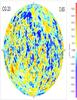
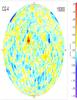
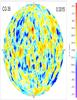
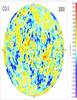
Fig. 7
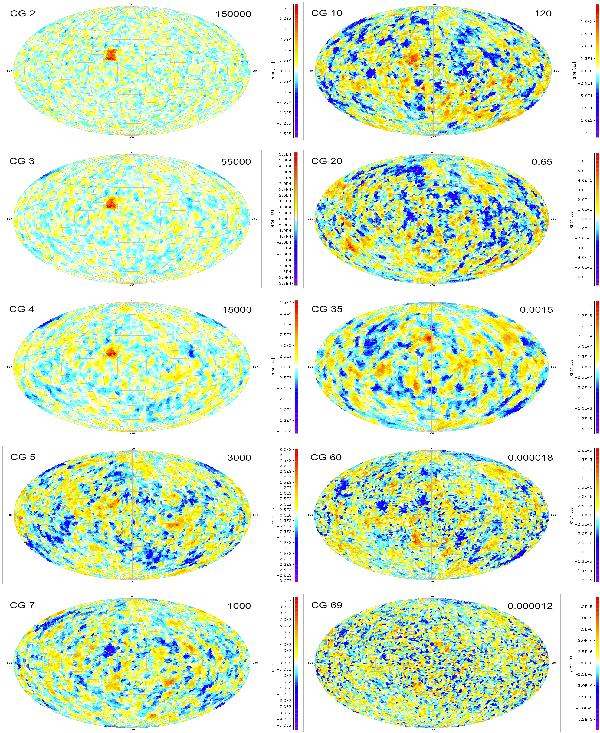
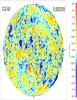
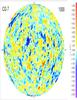
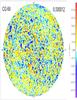
Truncation error maps for test case A2 (same as A1 but with different initial values) at selected iterations in the CG scheme. More of the first few iterations are shown in order to illustrate the diffusion of the large, localized initial errors. See Fig. 2 for further explanation of the diagram layout.
This figure is made of several images, please see below:
Current usage metrics show cumulative count of Article Views (full-text article views including HTML views, PDF and ePub downloads, according to the available data) and Abstracts Views on Vision4Press platform.
Data correspond to usage on the plateform after 2015. The current usage metrics is available 48-96 hours after online publication and is updated daily on week days.
Initial download of the metrics may take a while.