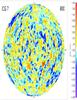
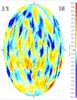
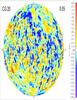
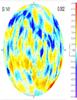
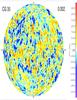
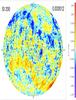
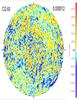
Fig. 5
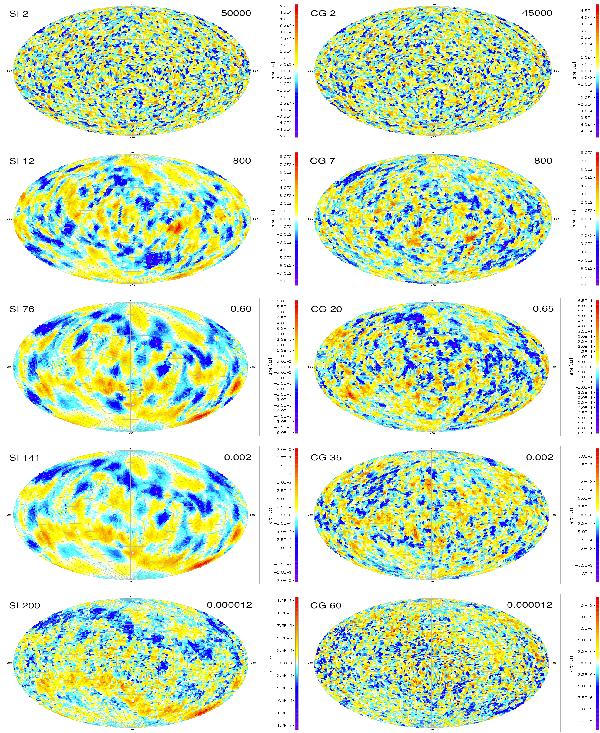
Truncation error maps for test case A1 at selected points in the simple iteration scheme (SI, left column) and conjugate gradient scheme (CG, right column). See Fig. 2 for further explanation of the diagram layout. Each map shows the difference between the result in the current iteration and the (presumably converged) solution obtained after 250 (SI) or 100 (CG) iterations. Although the parallaxes have converged more or less to their final values after iteration 76 (SI) or 20 (CG), as shown in Fig. 4, there are then still spatially correlated truncation errors at the ± 0.6 μas level in both solutions.
Current usage metrics show cumulative count of Article Views (full-text article views including HTML views, PDF and ePub downloads, according to the available data) and Abstracts Views on Vision4Press platform.
Data correspond to usage on the plateform after 2015. The current usage metrics is available 48-96 hours after online publication and is updated daily on week days.
Initial download of the metrics may take a while.