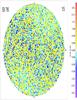
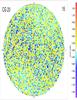
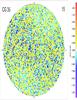
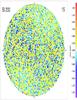
Fig. 4
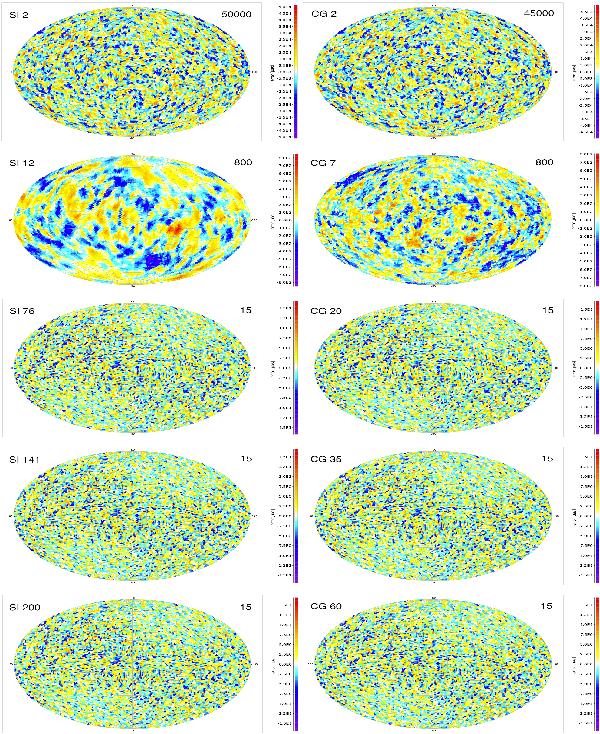
Error maps for test case A1 (including observation noise) at selected points in the simple iteration scheme (SI, left column) and conjugate gradient scheme (CG, right column). See Fig. 2 for further explanation of the diagram layout. Starting from identical initial parallax values, SI and CG converge to the same solution, although along different paths. Apparently, the parallaxes have converged more or less to their final values after iteration 76 (SI) or 20 (CG), but as shown in Fig. 5 there are then still significant, spatially correlated truncation errors that require many more iterations to be completely removed.


Current usage metrics show cumulative count of Article Views (full-text article views including HTML views, PDF and ePub downloads, according to the available data) and Abstracts Views on Vision4Press platform.
Data correspond to usage on the plateform after 2015. The current usage metrics is available 48-96 hours after online publication and is updated daily on week days.
Initial download of the metrics may take a while.