Fig. 11
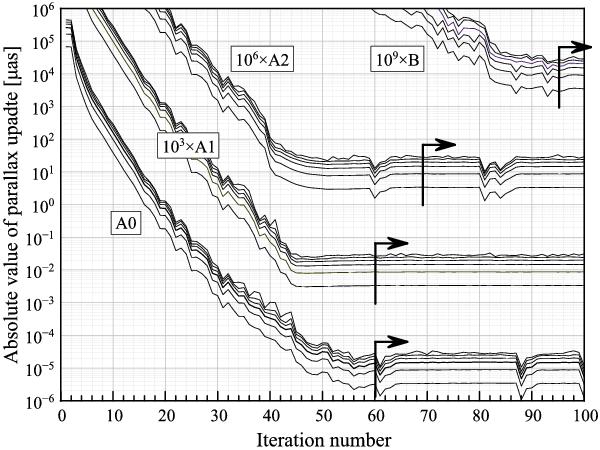
Statistics of the parallax updates for the CG solutions in Case A0, A1, A2 and B. In each Case the fives curves show, from bottom up, the quantiles q0.5 (median), q0.9, q0.99, q0.999, and q0.9999 of the absolute values of the parallax updates in each iteration. The thick vertical lines with arrows indicate the iterations where the solutions had effectively converged according to the truncation errors maps. For better visibility the curves in Case A1, A2 and B have been shifted upwards by 3, 6 and 9 dex, respectively.
Current usage metrics show cumulative count of Article Views (full-text article views including HTML views, PDF and ePub downloads, according to the available data) and Abstracts Views on Vision4Press platform.
Data correspond to usage on the plateform after 2015. The current usage metrics is available 48-96 hours after online publication and is updated daily on week days.
Initial download of the metrics may take a while.