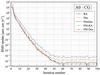
Fig. 1
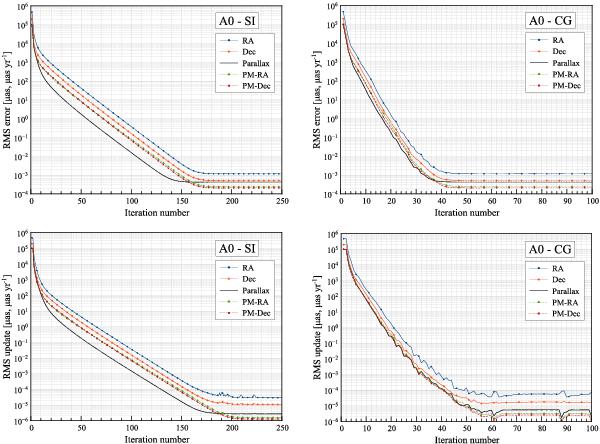
Convergence plots for test case A0 (without observation noise), using the simple iteration scheme (SI, left diagrams), and the conjugate gradient scheme (CG, right diagrams). The top diagrams show the rms errors of the astrometric parameter (i.e., the rms differences between the calculated and true values). The bottom diagrams show the rms updates of the astrometric parameters.
Current usage metrics show cumulative count of Article Views (full-text article views including HTML views, PDF and ePub downloads, according to the available data) and Abstracts Views on Vision4Press platform.
Data correspond to usage on the plateform after 2015. The current usage metrics is available 48-96 hours after online publication and is updated daily on week days.
Initial download of the metrics may take a while.