Free Access
Fig. 7
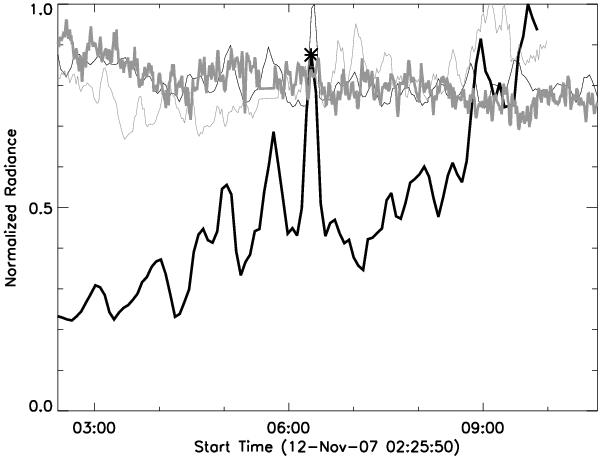
Light-curves during blinker group 3 in CDS O v 629 Å (thick black line), EUVI 171 Å (thin black line), SOT Ca ii H (thin grey line) and XRT Al_poly (thick grey line). The asterisk symbol indicates the peak in CDS O v 629 Å.
Current usage metrics show cumulative count of Article Views (full-text article views including HTML views, PDF and ePub downloads, according to the available data) and Abstracts Views on Vision4Press platform.
Data correspond to usage on the plateform after 2015. The current usage metrics is available 48-96 hours after online publication and is updated daily on week days.
Initial download of the metrics may take a while.