Free Access
Fig. 10
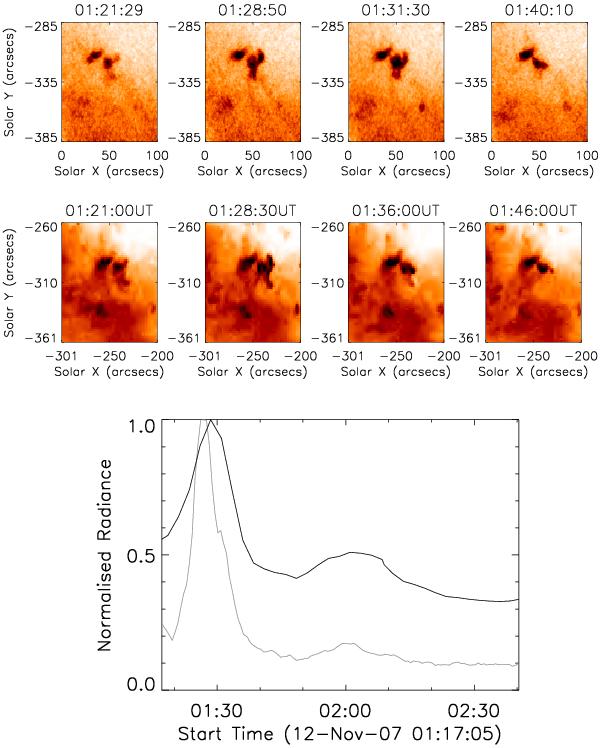
The coronal bright point jet B1 Fig. 8) showing expansion and eruption of loop structures as observed in XRT Al_poly and EUVI 171 Å images. The bottom panel shows the light-curves of the blinker event B1 peaking simultaneously in XRT (grey line) and EUVI 171 Å (black line).
This figure is made of several images, please see below:
Current usage metrics show cumulative count of Article Views (full-text article views including HTML views, PDF and ePub downloads, according to the available data) and Abstracts Views on Vision4Press platform.
Data correspond to usage on the plateform after 2015. The current usage metrics is available 48-96 hours after online publication and is updated daily on week days.
Initial download of the metrics may take a while.