Fig. 13
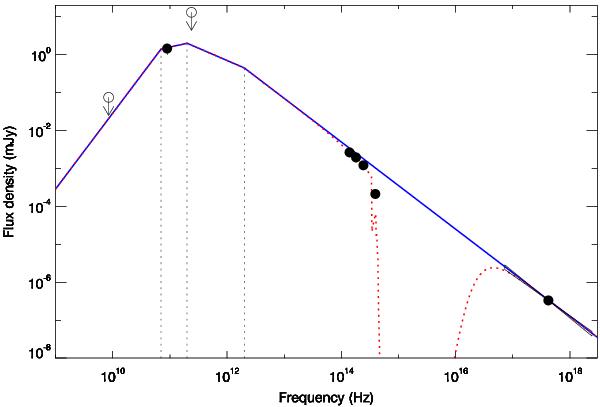
SED of GRB 050904 at redshift z = 6.29 (Kawai et al. 2006) using the detection from PdBI 5.896 days after the burst (Castro-Tirado et al., in prep.). The X-ray flux is estimated from the XRT light curve, the radio data are from Frail et al. (2006), while optical/NIR are extrapolations from Tagliaferri et al. (2005); Haislip et al. (2006). For the rough synchrotron spectrum drawn in blue, we have assumed an electron energy distribution index of p = 2.30, while an SMC extinction with AV = 0.12 (consistent with the value derived by Stratta et al. 2011; but see also Zafar et al. 2010) and Lyman blanketing (Madau 1995) have been considered in the red dotted line to match the optical/NIR observations. With these data we can constrain the position of νa < 2 × 10¹¹ Hz and 2 × 10¹¹ < νc < 1013 Hz.
Current usage metrics show cumulative count of Article Views (full-text article views including HTML views, PDF and ePub downloads, according to the available data) and Abstracts Views on Vision4Press platform.
Data correspond to usage on the plateform after 2015. The current usage metrics is available 48-96 hours after online publication and is updated daily on week days.
Initial download of the metrics may take a while.