Fig. 12
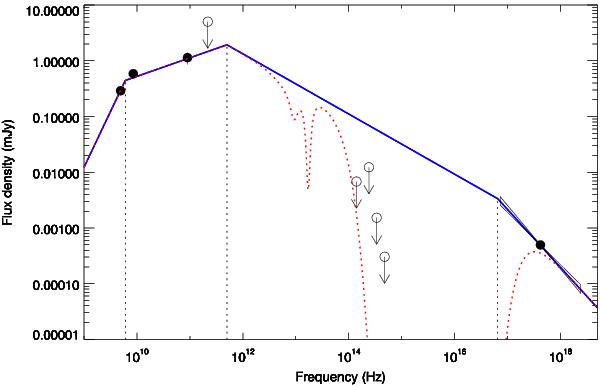
SED of the afterglow of the dark GRB 051022. Filled dots mark detections while empty dots and arrow mark detection limits. In blue we draw a synchrotron spectrum that can explain the radio and X-ray emission, while the optical/nIR data (1014−15 Hz) lie well bellow. Adding a Small Magellanic Cloud (SMC) extinction of AV ~ 15 results in a SED (red dotted line) consistent with all the data (data obtained from Cameron & Frail 2005; Bremer et al. 2005; Castro-Tirado et al. 2007).
Current usage metrics show cumulative count of Article Views (full-text article views including HTML views, PDF and ePub downloads, according to the available data) and Abstracts Views on Vision4Press platform.
Data correspond to usage on the plateform after 2015. The current usage metrics is available 48-96 hours after online publication and is updated daily on week days.
Initial download of the metrics may take a while.