Fig. 5
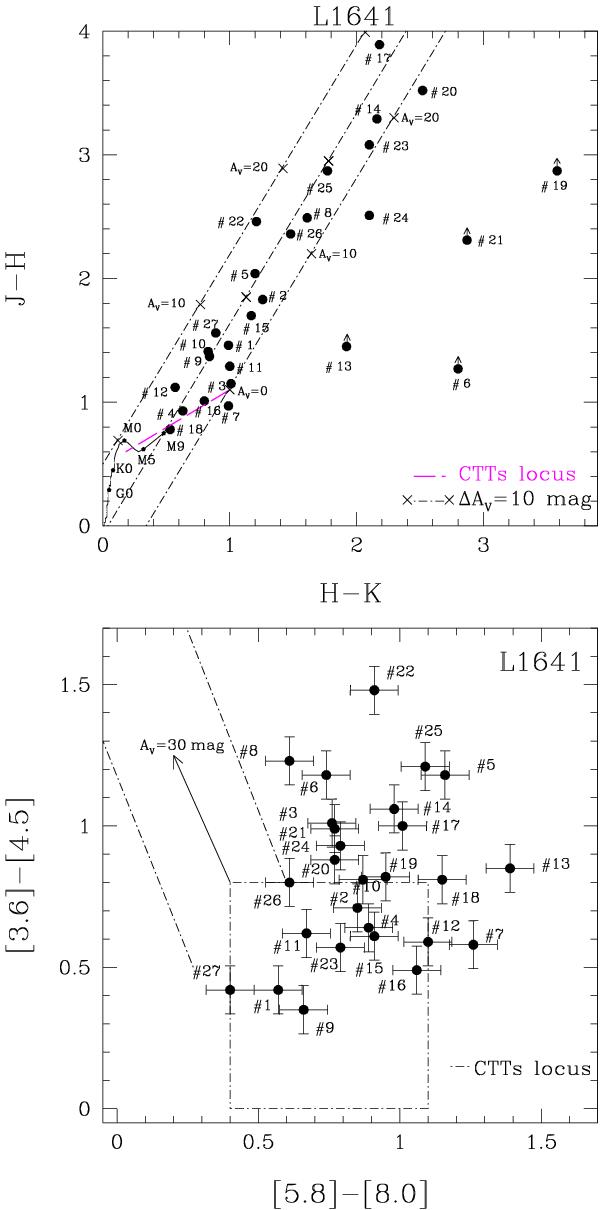
Top panel: JH vs. HK diagram for our L1641 targets. Dwarf MS and classical T Tauri loci (Meyer et al. 1997) are indicated by a continuous black line and a dashed magenta line, respectively. Black dotted dashed lines show the reddening vectors. Bottom panel: IRAC colour − colour diagram for the L1641 targets. The black dotted dashed rectangle delineates the domain of Class II YSOs (Allen et al. 2004), two parallel lines indicate the locus of reddened Class II sources (Megeath et al. 2004), and an average reddening vector for AV = 30 mag is plotted, as well.
Current usage metrics show cumulative count of Article Views (full-text article views including HTML views, PDF and ePub downloads, according to the available data) and Abstracts Views on Vision4Press platform.
Data correspond to usage on the plateform after 2015. The current usage metrics is available 48-96 hours after online publication and is updated daily on week days.
Initial download of the metrics may take a while.