Fig. 15
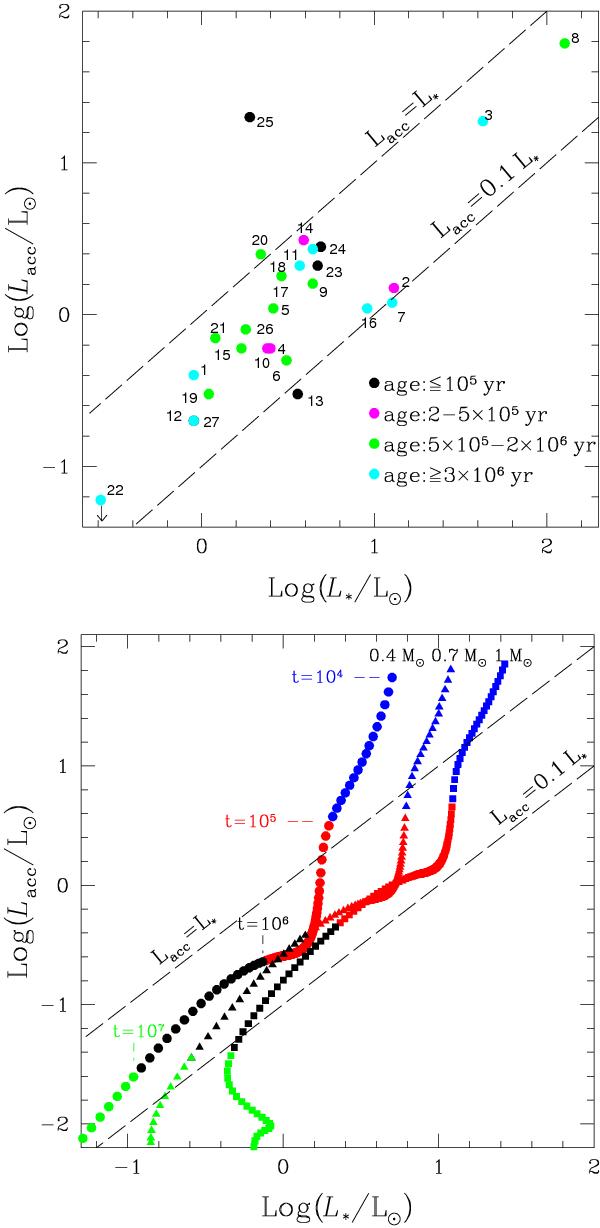
Top panel: Lacc vs. L∗ as in Fig. 12, with colours indicating the different age of the objects as bottom panel of Fig. 13. Bottom panel: simulation of the Lacc vs. L∗ temporal evolution for YSOs of different masses (0.4, 0.7, and 1 M⊙), derived considering the evolutionary tracks from Siess et al. (2000) and a viscous disc evolution with Ṁacc ∝ t−η, with η = 1.2. Different colours indicate different age, ranging from 104 to 107 yr.
Current usage metrics show cumulative count of Article Views (full-text article views including HTML views, PDF and ePub downloads, according to the available data) and Abstracts Views on Vision4Press platform.
Data correspond to usage on the plateform after 2015. The current usage metrics is available 48-96 hours after online publication and is updated daily on week days.
Initial download of the metrics may take a while.