Fig. 14
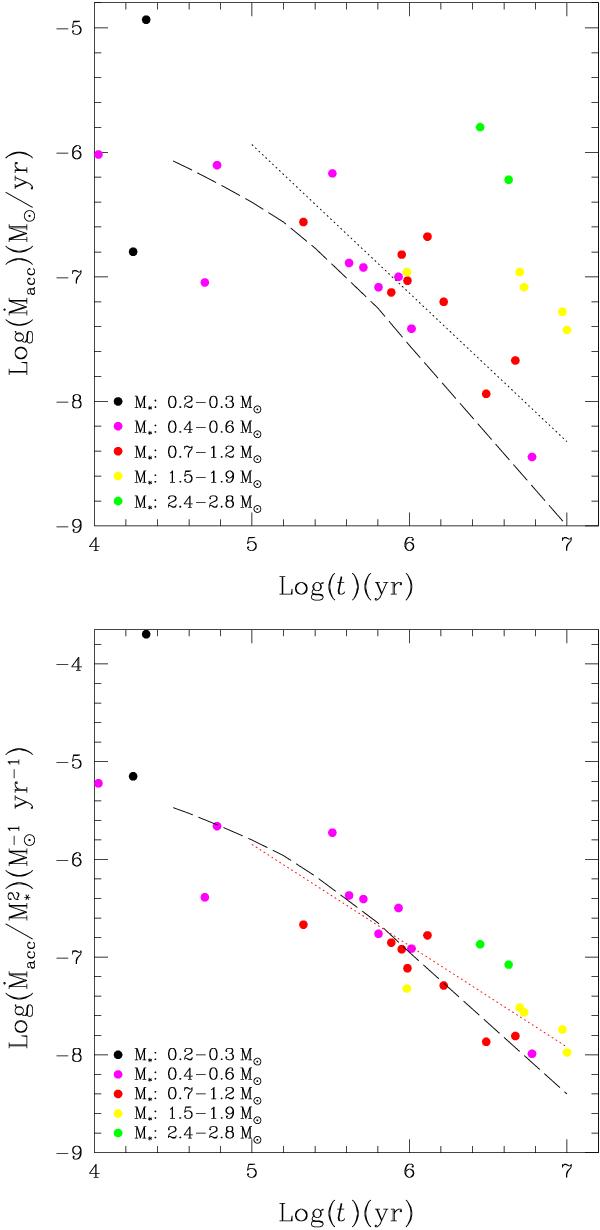
Top panel: mass accretion rate as a function of stellar age for
the observed sample. The various colours indicate different mass values. The
dashed line displays one of the viscous models of Hartmann et al. (1998), for a
M∗ = 0.5 M⊙, an
initial disc mass
Md = 0.1 M⊙,
viscosity parameter α = 10-2, and viscosity exponent
γ = 1, i.e. η = 1.5 in the
Ṁacc ∝ t−η
relationship. The red dotted line shows the best linear fit for data points with
0.4 ≤ M∗ ≤ 1.2 M⊙
and t > 105 yr,
i.e. Ṁacc ∝ t-1.2.
Bottom panel: same as top panel, but with the
Ṁacc values normalised to the
stellar  , to take
into account Ṁacc dependence
from M∗.
, to take
into account Ṁacc dependence
from M∗.
Current usage metrics show cumulative count of Article Views (full-text article views including HTML views, PDF and ePub downloads, according to the available data) and Abstracts Views on Vision4Press platform.
Data correspond to usage on the plateform after 2015. The current usage metrics is available 48-96 hours after online publication and is updated daily on week days.
Initial download of the metrics may take a while.