Fig. 13
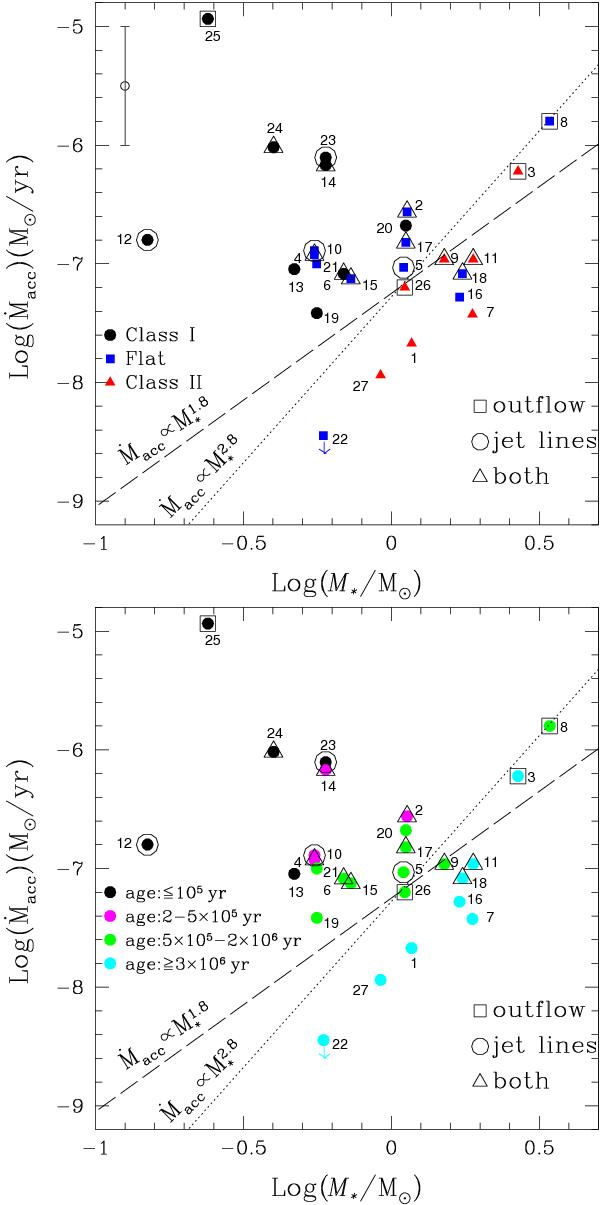
Top panel: mass accretion rate versus stellar mass for the all
sample. The different symbols indicate the class of the objects: Class I, Flat, or
Class II (dots, squares, and triangles, respectively). The object ID is also
reported. The presence of jets/outflows in the images, lines tracing jets in the
spectra, or both are indicated by open squares, circles, or triangles,
respectively. The dashed line shows the  relationship obtained by Natta et al.
(2006) for the Ophiuchus sample, whereas the dotted line displays the
relationship obtained by Natta et al.
(2006) for the Ophiuchus sample, whereas the dotted line displays the
 relationship obtained by Fang et al. (2009)
for the L 1634 and the L 1641 samples. The lines are merely indicative and do not
fit the data. Bottom panel: same as top panel, with colours
indicating the different age of the objects, ranging from ≤ 105
to 107 yr.
relationship obtained by Fang et al. (2009)
for the L 1634 and the L 1641 samples. The lines are merely indicative and do not
fit the data. Bottom panel: same as top panel, with colours
indicating the different age of the objects, ranging from ≤ 105
to 107 yr.
Current usage metrics show cumulative count of Article Views (full-text article views including HTML views, PDF and ePub downloads, according to the available data) and Abstracts Views on Vision4Press platform.
Data correspond to usage on the plateform after 2015. The current usage metrics is available 48-96 hours after online publication and is updated daily on week days.
Initial download of the metrics may take a while.