Fig. 3
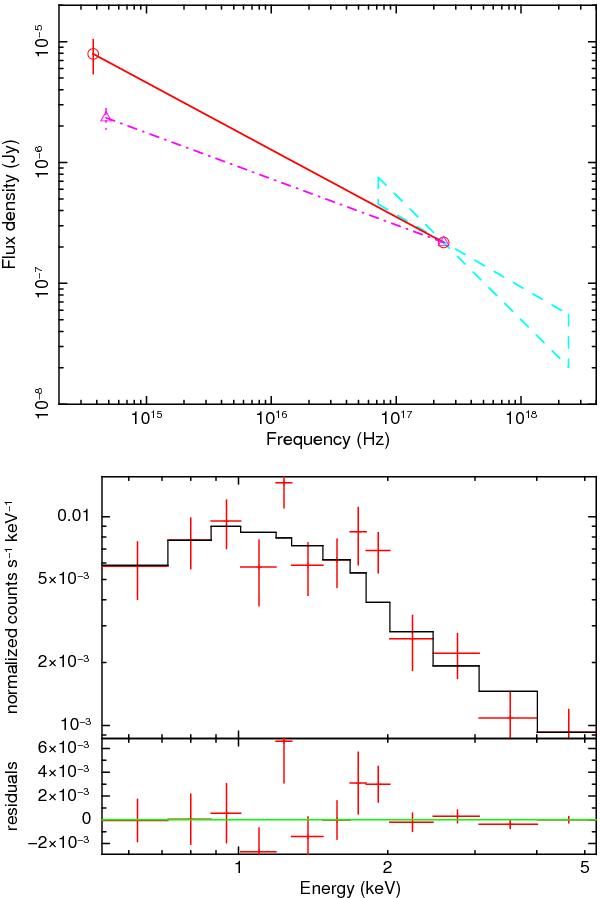
Upper panel: the optical-to-X-ray spectral energy distribution of the afterglow of GRB 100219A is shown in the upper panel. The X-ray point corresponds to 1 keV. The values of βOX relative to the I-band (unaffected by the Lyα blanketing) and R-band (affected by the Lyα blanketing) are 0.56 (t = 34 ks) and 0.41 (t = 35 ks), marked with a solid line and a dash-dotted line, respectively. The Galactic correction E(B − V) = 0.08 is used. Lower panel: fitting of the late X-ray spectrum with a broken power-law. The time interval is between 5.0 × 10³ s and 1.8 × 10⁵ s.
Current usage metrics show cumulative count of Article Views (full-text article views including HTML views, PDF and ePub downloads, according to the available data) and Abstracts Views on Vision4Press platform.
Data correspond to usage on the plateform after 2015. The current usage metrics is available 48-96 hours after online publication and is updated daily on week days.
Initial download of the metrics may take a while.