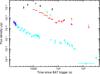
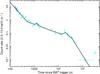
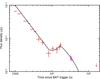
Fig. 2
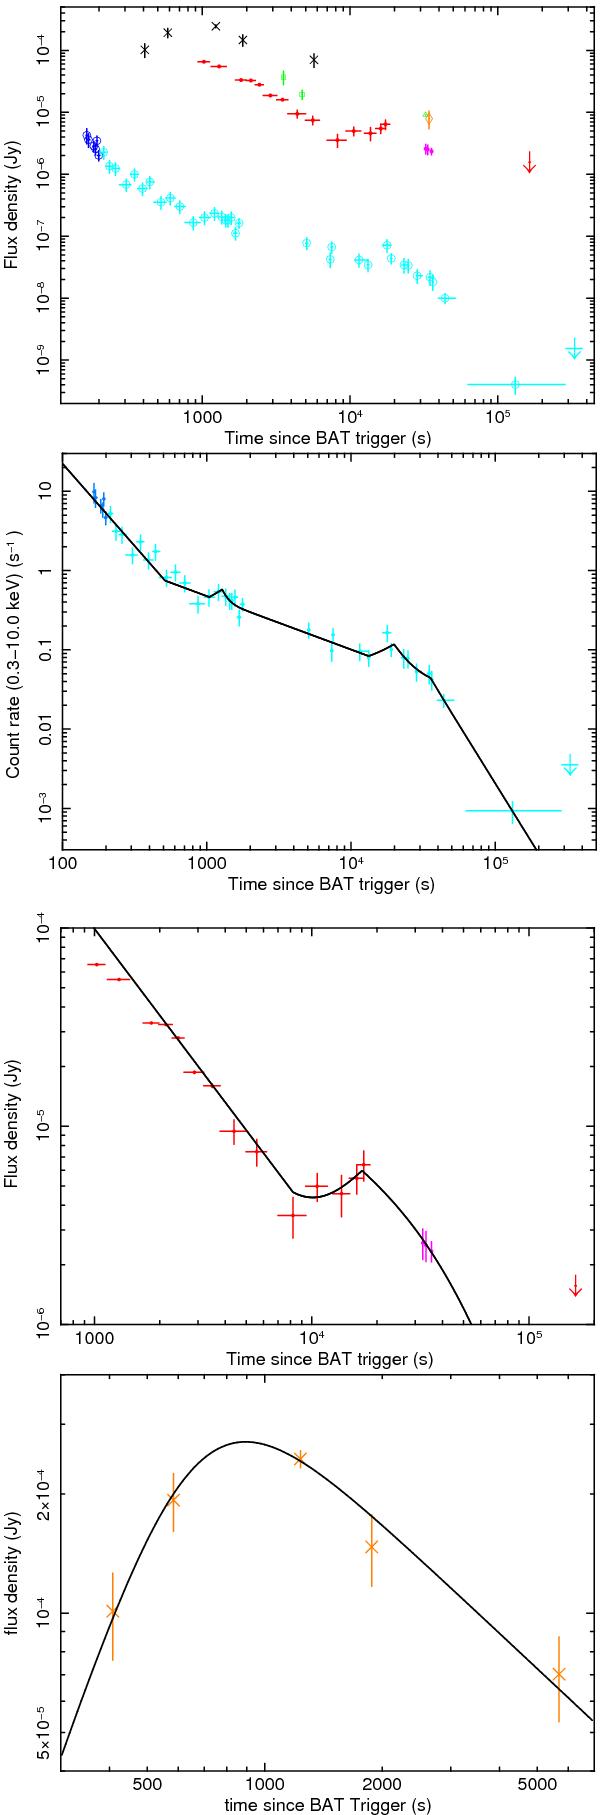
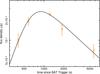
Panel 1: multi-wavelength light curves of the GRB 100219A afterglow. The X-ray light curve at 1 keV is represented by empty circles (dark blue: WT data; light blue: PC data). The values in the plot are 10 times lower than the real ones for presentation purposes. The GMG and NOT R-band data are denoted by dots (red: GMG data; pink: NOT data). The I-band datum from the NOT is indicated by a diamond (orange color). The GAO 150 cm RC and IC band observations are denoted by empty squares (green color). The Akeno and Okayama MITSuME optical IC-band observations are denoted by crosses (black color). The GROND i′-band observation is marked with a triangle (green color). Panel 2: the whole X-ray light curve fitting from about 100 s to 4 × 10⁴ s after the burst trigger and two X-ray bumps are included in the fitting. Panel 3: the fitting of optical R-band light curve of GMG and NOT observations from about 1000 s to 2 × 10⁵ s after the burst trigger and the late optical bump is included. Panel 4: the fitting of optical IC band light curve of MITSuME observation from about 400 s to 6000 s after the burst trigger and the early optical bump is clearly shown. The solid line in each panel is the light curve fitting result.
Current usage metrics show cumulative count of Article Views (full-text article views including HTML views, PDF and ePub downloads, according to the available data) and Abstracts Views on Vision4Press platform.
Data correspond to usage on the plateform after 2015. The current usage metrics is available 48-96 hours after online publication and is updated daily on week days.
Initial download of the metrics may take a while.